
Classic / Apple, Dell, Financial Ratios, key indicators, Mohamed Ogbi, Proimpact, Proimpact Marketing Consultancy / June 1, 2015
Dell Financial Ratios, Analysis and a comparison (Apple vs Dell)
Michael Dell will take Dell Inc. private for $24.4 billion in the biggest leveraged buyout since the financial crisis a deal that allows the billionaire chief executive to attempt a revival of his struggling computer company without Wall Street scrutiny. “Reuters (2013)”
Dell Financial Analysis
Introduction
Dell is a multinational corporation known currently as “Dell computer”. The company has been established in 1984 by Michael Dell after getting about $300,000 in expansion-capital from his family “crowdrank.net (2012)” under the name “PC’s Limited” in Round Rock, Texas, United states
1985 the company produced its first computer system, the Turbo PC, featuring an Intel® 8088 processor running at 8MHz, a 10MB hard drive and a 5.25″ floppy drive. “Koehn, Nancy Fowler (2001)”.
1986 Dell unveil the industry’s fastest performing PC — a 12MHz, 286-based system — at the Spring Comdex trade show.”Dell.com (2013)”.
1987 the company opens its first international subsidiary in the United Kingdom. ”Dell.com (2013)”.
1990 Dell opened a manufacturing center in Limerick, Ireland, to better serve customers in Europe, the Middle East and Africa.
Today Dell is one of the largest technology providers in the world developing, selling, repairing, supporting computers and related products and services employing more than 103,300 people worldwide. Dell is listed at number 44 in the fortune 500 list and the third largest pc vendor in the world after HP and Lenovo. “Form 10-K. Jan 1, (2009)”
In the news
Michael Dell will take Dell Inc. private for $24.4 billion in the biggest leveraged buyout since the financial crisis a deal that allows the billionaire chief executive to attempt a revival of his struggling computer company without Wall Street scrutiny. “Reuters (2013)”
Condensed Consolidated Statement of Financial Position
(In millions)
Assets: 2010 2011 2012
| : | 20 | 2011 | 2012 |
| Cash & cash equivalents | $ 10,635 | $ 13,913 | $ 13,852 |
| Short-term investments | 373 | 452 | 966 |
| Accounts receivable, net | 5,837 | 6,493 | 6,476 |
| Short-term financing receivables, net | 2,706 | 3,643 | 3,327 |
| Inventories, net | 1,051 | 1,301 | 1,404 |
| Other | 3,643 | 3,219 | 3,423 |
| Total current assets | 24,245 | 29,021 | 29,448 |
| PP&E, net | 2,181 | 1,953 | 2,124 |
| Investments | 781 | 704 | 3,404 |
| Long-term financing receivable, net | 332 | 799 | 1,372 |
| Other non-current assets | 6,113 | 6,122 | 8,185 |
| Total assets: | 33,652 | 38,599 | 44,533 |
Liabilities & Stockholders’ Equity:
| Short-term borrowings | 663 | 851 | 2,867 |
| Accounts payable | 11,373 | 11,293 | 11,656 |
| Accrued and other | 3,884 | 4,181 | 3,934 |
| Short-term deferred services revenue | 3,040 | 3,158 | 3,544 |
| Total current liabilities | 18,960 | 19,483 | 22,001 |
| Long-term debt | 3,417 | 5,146 | 6,387 |
| Long-term deferred services revenue | 3,029 | 3,518 | 3,836 |
| Other non-current liabilities | 2,605 | 2,686 | 3,392 |
| Total liabilities: | 28,011 | 30,833 | 35,616 |
| Column1 | Column2 | Column3 | Column4 |
| Total Dell stockholder’s equity | 5,641 | 7,766 | 8,917 |
| Non-controlling interest | – | – | – |
| Total stockholder’s equity: | 5,641 | 7,766 | 8,917 |
| Total liabilities & equity: | $33,652 | $38,599 | $ 44,533 |
“Dell.com/financial reporting (2013)”.
Condensed Consolidated Statement of Operations
(IN millions)
| 2010 | 2011 | 2012 | |
| Net revenue | $ 52,902 | $ 61,494 | $ 62,071 |
| Y/Y Growth | -13% | 16% | 1% |
| Cost of revenue | 43,641 | 50,098 | 48,260 |
| Gross margin | 9,261 | 11,396 | 13,811 |
| SG&A | 6,465 | 7,302 | 8,524 |
| R&D | 624 | 661 | 856 |
| Total operating expenses | 7,089 | 7,963 | 9,380 |
| Operating income | 2,172 | 3,433 | 4,431 |
| Investment and other income, net | -148 | -83 | -191 |
| Income before taxes | 2,024 | 3,350 | 4,240 |
| Income tax provision | 591 | 715 | 748 |
| Net income | 1,433 | 2,635 | 3,492 |
“Dell.com/financial reporting (2013)”.
Dell financial ratios
Liquidity:
| 2010 | 2011 | 2012 | |
| Current assets | 24,245 | 29,021 | 29,448 |
| Inventory | 1,051 | 1,301 | 1,404 |
| Current liabilities | 18,960 | 19,483 | 22,001 |
| Quick ratio | 1.22 | 1.42 | 1.27 |
| Quick ratio % | 122% | 124% | 127% |
| Current ratio % | 127% | 148% | 133% |
Dell has a Quick ratio higher than the text book ideal of 100% but it might be higher because dell does not store its inventory instead they start the production as soon as the order is made.
Typically, short-term creditors will prefer a high current ratio because it reduces their overall risk. However, investors may prefer a lower current ratio since they are more concerned about growing the business using assets of the company. Acceptable current ratios may vary from one sector to another, but generally accepted benchmark is to have current assets at least as twice as current liabilities. “Macroaxis.com (2013)”
In accordance with recently published financial statements Dell Inc. has Current Ratio of 1.33 times. This is 62.06% lower than that of dell Technologies sector, and 13.24% lower than that of Personal computers industry, The Current Ratio for all stocks is 50.21% higher than the company.
The text book ideal for a current ratio is 200% but dell’s current ratio is almost the same to the industry average this year of 130%
Profitability:
| profitability | 2010 | 2011 | 2012 |
| Net income | 1,433 | 2,635 | 3,492 |
| Shareholders’ funds | 5,641 | 7,766 | 8,917 |
| Returns on shareholders’ funds | 25.40% | 33.90% | 39.10% |
| Returns on total capital | 17% | 21% | 20% |
| Revenues | 52,902 | 61,494 | 62,071 |
| Gross profit | 9,261 | 11,396 | 13,811 |
| Gross profit margin | 17,5% | 18,5% | 22,2% |
| Net profit margin | 2,7% | 4,2% | 5,6% |
| Expenses | 7,089 | 7,963 | 9,380 |
| Expenses ratio | 13,4% | 12,9% | 15,1% |
The profit margin is still recovering in compare to the net profit margin for dell in 2007 which was 4.49% but still a bit low comparing to the net profit margin for apple which has the net profit margin of 23.9% in 2011 and it could be for:
- Apple’s integrated product offerings include a big software and service component. Software and services typically have higher margins.
- Apple has a small number of distinct products (for their size of revenue) and has a very good supply chain management focus, together this allows them to get economies of scale and excellent pricing on inputs.
- Apple has successfully put a strong emphasis on design and usability and is being rewarded in pricing power and good margins. “Quora.com (2011)”
On the other hand dell most of the revenues are coming from the selling of desktops & mobility computers but the sales of these products are decreasing due to the fact that customers are changing from pcs and laptops to tablets and smartphones which led the company to loose a lot of its customers and keep selling to corporations and pioneers.
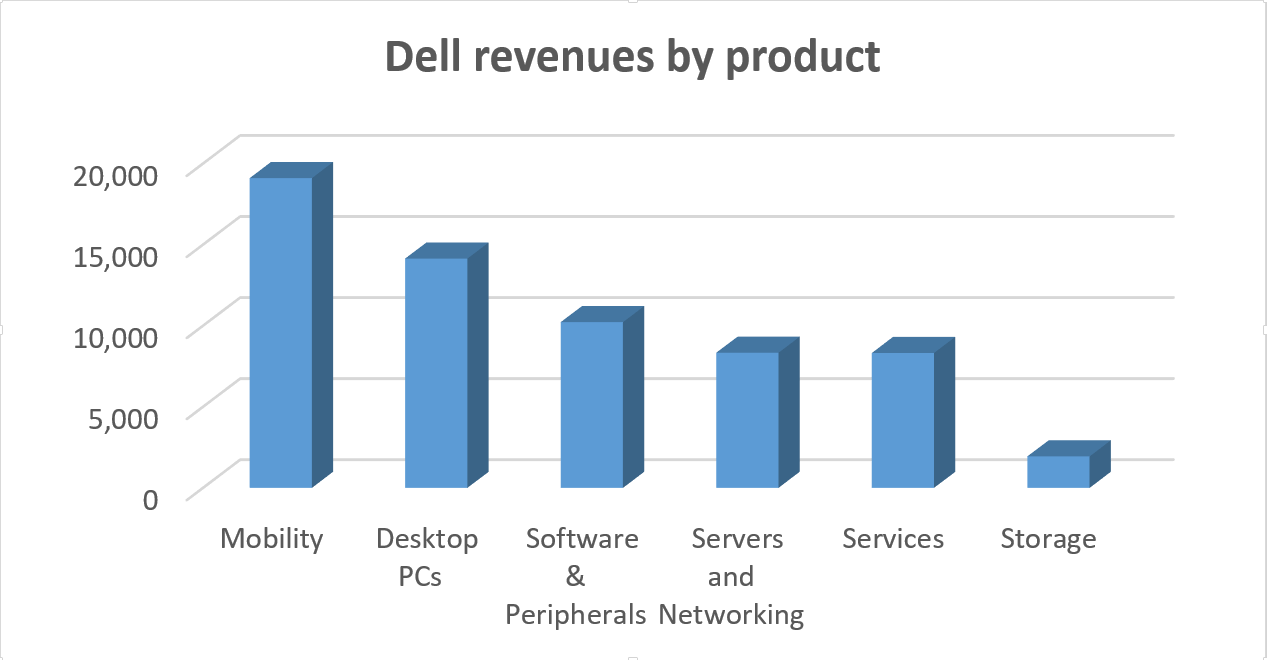
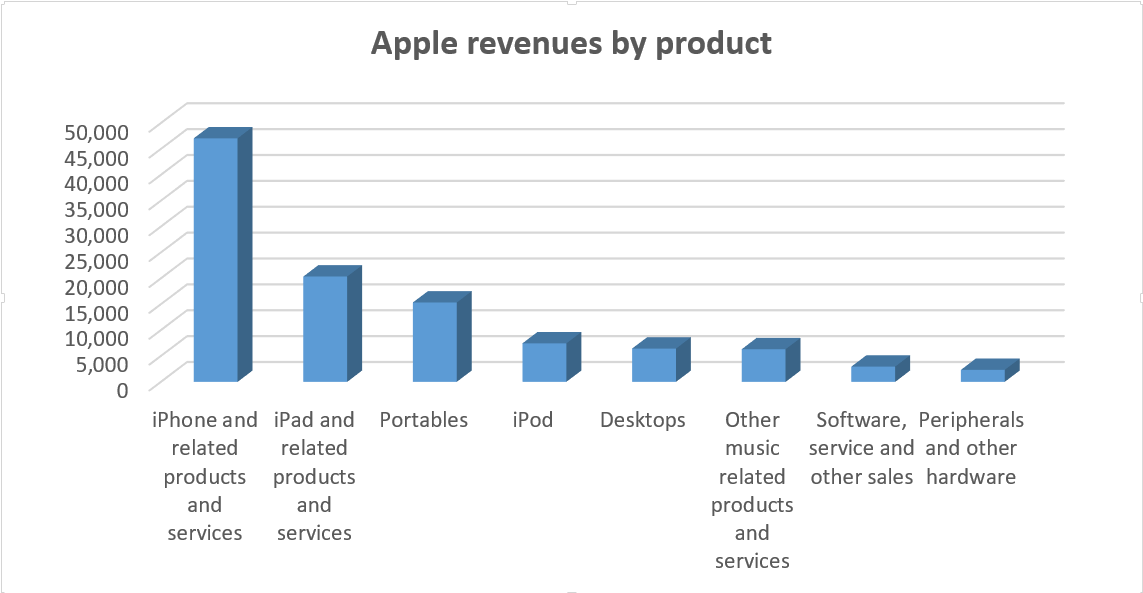
By comparing these graphs we can see that dell has less variety than apple which increase apple’s revenues but on the other hand if we compare total sales of apple desktops and laptops (21,783) to dell (33,248) that dell is still professional in this direction.
Gearing:
| 2010 | 2011 | 2012 | |
| Long-term debt | 3,417 | 5,146 | 6,387 |
| Short term borrowings | 663 | 851 | 2,867 |
| Total debt | 4,080 | 5,997 | 9,254 |
| Equity | 5,641 | 7,766 | 8,917 |
| Total Debt-equity | 41.90% | 43.50% | 50.90% |
| Long term debt-equity | 0.37 | 0.39 | 0.41 |
By looking at the debt equity ratio and comparing it to the company’s performance in 2008 we find that dell had a debt of 362 and a debt equity ratio of 0.086 which tells us that the company’s debt is increasing every year, also the company’s borrowings are increasing even if the company’s current debt equity ratio of 50.9% still ideal but it puts doubts and questions about the company’s future.
Interest cover
| 2010 | 2011 | 2012 | |
| Operating income | 2,172 | 3,433 | 4,431 |
| Investment and other income | 148 | 83 | 191 |
| Interest cover | 14.6 | 41.3 | 23.19 |
By looking at all the previous data and the comparison between dell and competitors that dell should have been more productive, adaptive and understand the changing of customer behavior in order to succeed in an increasing competitive environment, invest in innovation and decrease their production costs to gain a superior value to their products.
Future strategy:
If Michael Dell took Dell Inc. private for $24.4 billion there might be a lot of changes in the future like for instance the company may entail job cuts and more costly acquisitions due to the continued restructuring to focus on the corporate market. The company might also start developing the technology and expand the variety of services especially after the $2 billion loan from Microsoft which dell was loyal to Microsoft’s Windows operating system and feed the competition between a supply chain and another. Dell might change its name to have a new design and a new marketing strategy.
References
- money.msn.com (n.d.) Balance Sheet – MSN Money. [online] Available at: http://investing.money.msn.com/investments/stock-balance-sheet/?symbol=us%3AAAPL&stmtView=Ann [Accessed: 23 Feb 2013].
- money.msn.com (n.d.) Income Statement – MSN Money. [online] Available at: http://investing.money.msn.com/investments/stock-income-statement/?symbol=AAPL [Accessed: 23 Feb 2013].
- apple.com (n.d.) Apple Inc. – Annual Report. [online] Available at: http://investor.apple.com/secfiling.cfm?filingID=1193125-11-282113&CIK=320193 [Accessed: 23 Feb 2013].
- Reuters (2012) Dell to go private in landmark $24.4 billion deal. [online] Available at: http://www.reuters.com/article/2013/02/05/us-dell-buyout-idUSBRE9140NF20130205 [Accessed: 23 Feb 2013].
- Us, D. (2012) Financial Reporting. [online] Available at: http://www.dell.com/Learn/us/en/uscorp1/investor-financial-reporting?c=us&l=en&s=corp&cs=uscorp1 [Accessed: 23 Feb 2013].
- Us, D. (2012) About Dell. [online] Available at: http://www.dell.com/Learn/us/en/uscorp1/about-dell?c=us&l=en&s=corp&ref=ff41&delphi:gr=true [Accessed: 23 Feb 2013].
- Koehn, Nancy Fowler (2001). Brand New: How Entrepreneurs Earned Consumers’ Trust from Wedgwood to Dell. Harvard Business Press. p. 287. ISBN 978-1-57851-221-8. Retrieved October 14, 2008
- “Form 10-K”. Dell Inc., United States Securities and Exchange Commission. March 31, 2011. Retrieved July 1, 2008. “For the fiscal year ended: Jan 1, 2009”
- net (2012) CrowdRank | Your Ranking Engine with Real Consumer Reports – Consumers Report and Vote. [online] Available at: http://www.crowdrank.net/review/Dell/tablet6 [Accessed: 25 Feb 2013].
- com (2013) Atari Current Ratio ATA.PA Paris. [online] Available at: http://www.macroaxis.com/invest/ratio/ATA.PA–Current_Ratio [Accessed: 25 Feb 2013].
- Quora (2011) Why does Apple have a net profit margin of 20% while HP and Dell are around 5%?. [online] Available at: http://www.quora.com/Why-does-Apple-have-a-net-profit-margin-of-20-while-HP-and-Dell-are-around-5 [Accessed: 25 Feb 2013].
- Us, D. (2012) The Birth of a Company. [online] Available at: http://www.dell.com/Learn/us/en/19/birth-of-company?c=us&l=en&s=x&cs=x1&delphi:gr=true [Accessed: 25 Feb 2013].


